Introduction
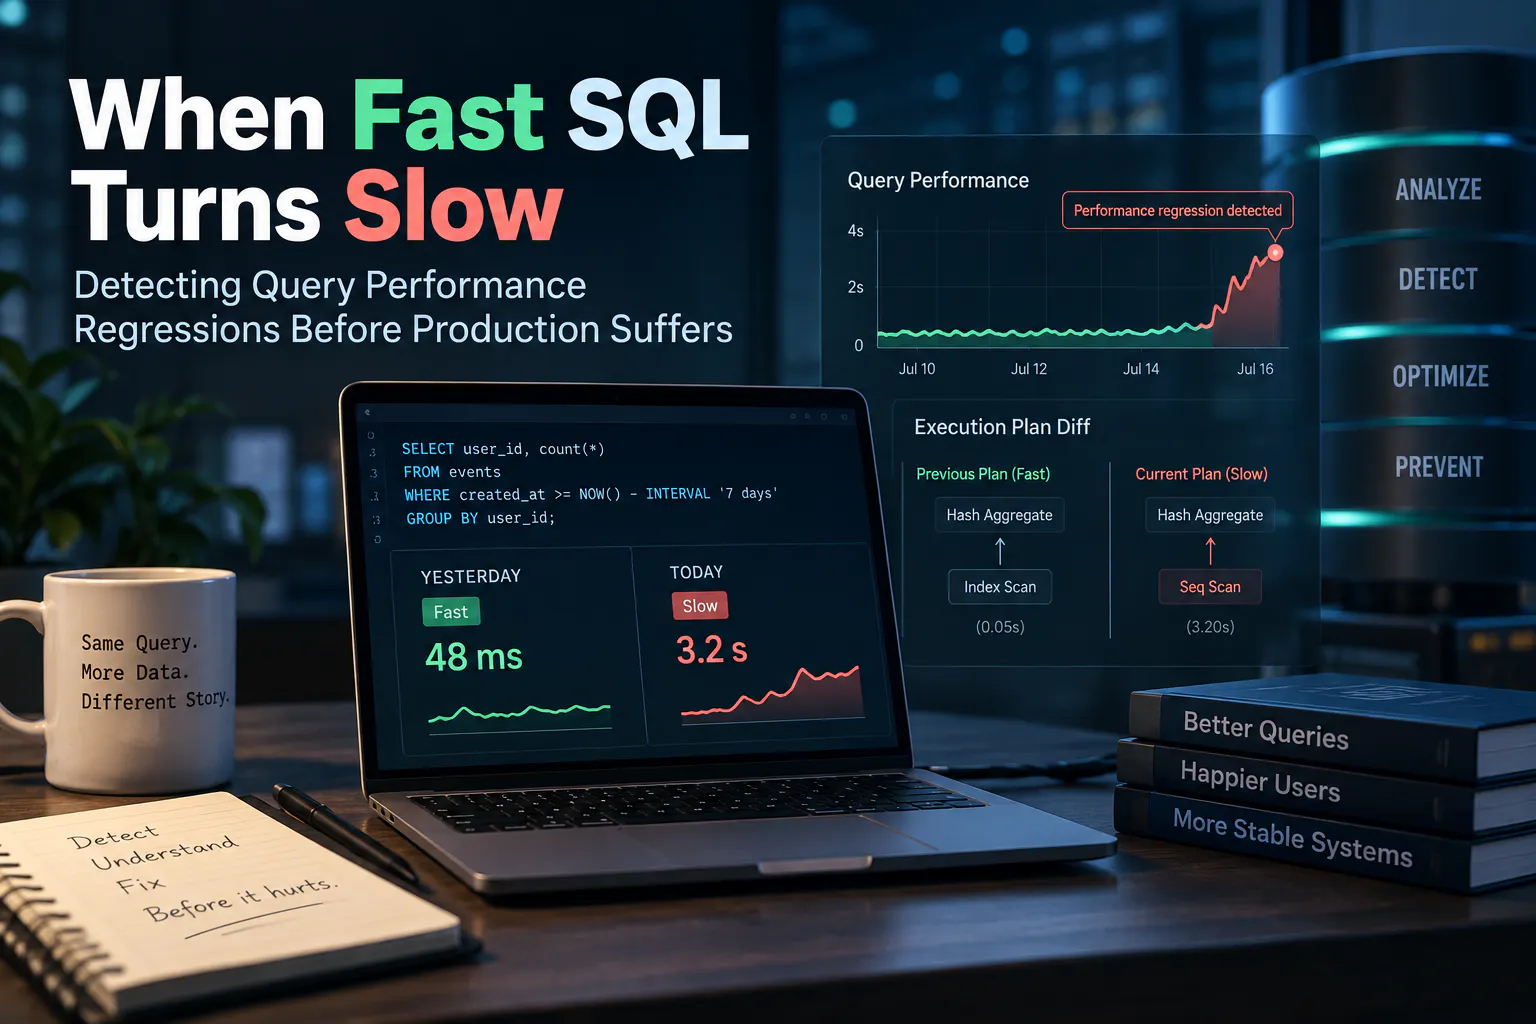
SQL performance problems often creep in gradually, turning a once-fast query into a bottleneck before anyone notices. When execution times stretch from 40 milliseconds to 400 milliseconds, the cause might be growing tables, shifting data distributions, cache behavior changes, or the optimizer choosing a different plan. Detecting these drifts early—before they manifest as outages—is the heart of proactive database monitoring.
What Happened
PostgreSQL continuously gathers execution statistics through pg_stat_statements, normalizing queries via a queryid hash that groups statements by structure regardless of literal values. The view captures calls, total execution time, rows returned, shared-buffer activity, temporary-block activity, WAL volume, and optional storage timing. A lightweight collector can snapshot these cumulative counters at regular intervals, computing per-invocation metrics such as average execution time and rows per call, while distinguishing between rows retrieved and rows scanned internally.
Why This Matters
Arithmetic means can mask deteriorating tail latency; a query may average 50 milliseconds while its 99th percentile steadily climbs, signaling hidden trouble. PostgreSQL's sampled logging—via log_min_duration_sample, log_statement_sample_rate, and %Q in the log prefix—can feed a dedicated table with observed durations, enabling continuous percentile calculations inside SQL. When stable averages hide real shifts, median absolute deviation and the modified z-score provide a robust outlier detection method that doesn't assume normal distribution.
Key Takeaways
- Normalize query identity using
pg_stat_statements.queryidso that executions with different literal values are grouped together. - Snapshot cumulative counters, compute deltas, and derive per-call execution time, rows returned, and buffer activity.
- Percentiles expose what averages hide; leverage sampled duration logging or external sampling to reconstruct p50, p95, and p99 latency.
- Build baselines from recent historical windows; use median absolute deviation and modified z-scores to flag meaningful shifts without overfitting to noise.
- Compare execution plans with
EXPLAIN (ANALYZE, BUFFERS, FORMAT JSON)to detect structural changes such as scan type switches, row estimate mismatches, and unexpected temporary-file activity. - Integrate regression checks into CI pipelines: restore representative data volume, execute critical queries repeatedly, compute latency percentiles, and diff plan output against an approved baseline.
Conclusion
Performance regressions are an inevitable part of growing systems, but they don't have to become user-facing incidents. By tracking normalized query fingerprints, maintaining percentile-aware baselines, and validating changes through plan comparison, teams can flag trouble early. The engineering investment remains deliberately small: persist history, score regressions, capture evidence, and let CI gate the rest.


Discussion
Join the conversation
Thoughtful reactions, questions, and follow-up ideas help shape the next story.